


1. What is AGP?
AGP (Ambulatory Glucose Profile) is a standardized report that visually presents continuous glucose monitoring (CGM) data. It integrates 7–14 days of glucose readings, helping you identify times of the day when glucose tends to be high or low, and guiding adjustments in diet, exercise, and medication with reference to metrics such as TIR (Time in Range).
Before interpreting an AGP report, first confirm whether the data is reliable.
Key criteria for reliability:
- Monitoring duration ≥ 14 days
- Sensor usage ≥ 70%
This ensures coverage of both weekdays and weekends and accurately reflects real-life glucose variability.
International guidelines recommend that standardized CGM reports generally include three modules:
- Ten core metrics
- AGP profile
- Daily glucose profile
Most CGM systems are built on this framework. Understanding these three sections will allow you to read most AGP reports effectively.
2. Module 1: Ten Core Metrics
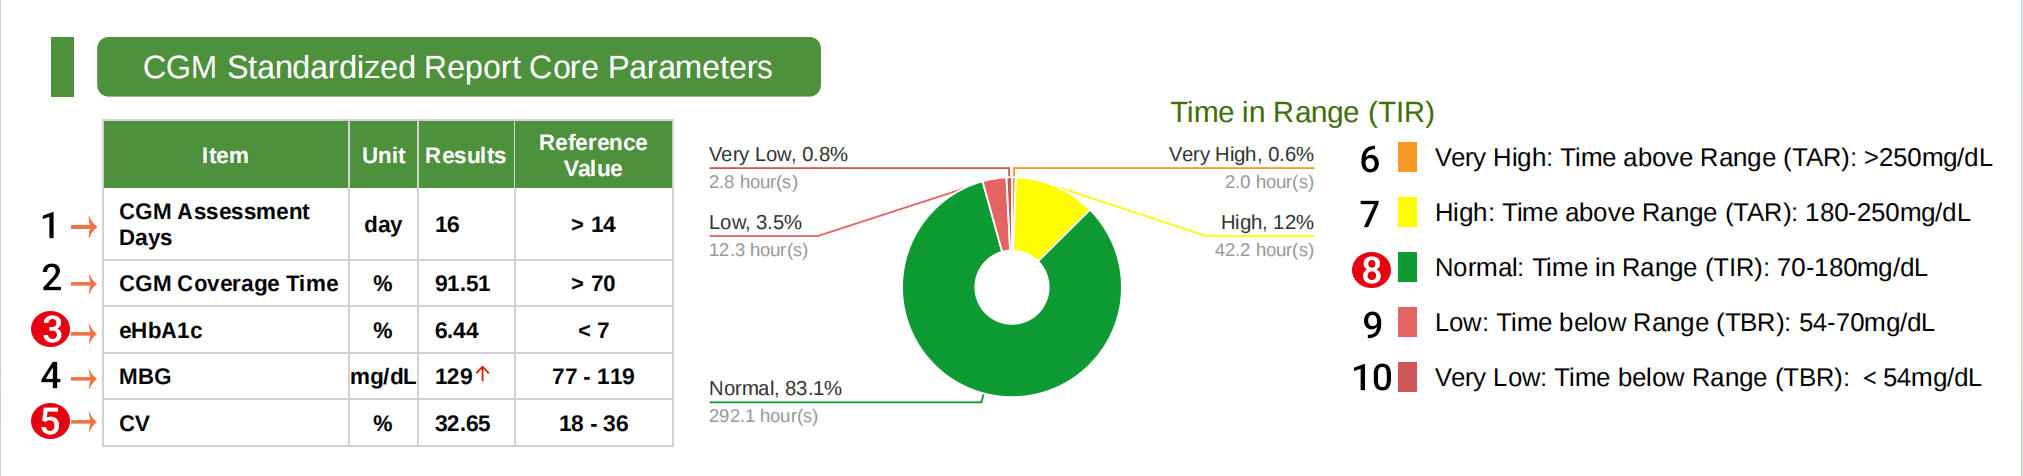

Among the ten core metrics, three are particularly important: eHbA1c , CV, and TIR.
1. eHbA1c (Estimated Hemoglobin A1c)
eHbA1c estimates the laboratory HbA1c level based on the average glucose values derived from continuous glucose monitoring (CGM) data.
It provides an approximation of long-term glycemic control by translating recent CGM-measured mean glucose into an HbA1c-equivalent value.
While it correlates with laboratory HbA1c, it may differ because it captures shorter-term glucose control and can be affected by data completeness or glucose variability.
Recommended target:
eHbA1c < 7%, consistent with standard HbA1c goals for most adults with diabetes.
2. CV (Coefficient of Variation)
CV indicates glucose variability and is calculated as standard deviation ÷ mean glucose.
Higher CV signifies greater fluctuations and less stable glucose control.
Recommended target: CV ≤ 36%
Maintaining low CV reduces the risk of alternating hyperglycemia and hypoglycemia.
3. TIR (Time in Range)
TIR represents the percentage of time glucose is within the target range (usually 3.9–10.0 mmol/L).
Higher TIR is associated with a lower risk of diabetes complications.
International consensus target: TIR ≥ 70% (approximately 17 hours per day in range)
You can review the journeys of Day 3 and Day 4 to learn more about TIR, TBR, and TAR.
3. Module 2: AGP MAP (Ambulatory Glucose Map)
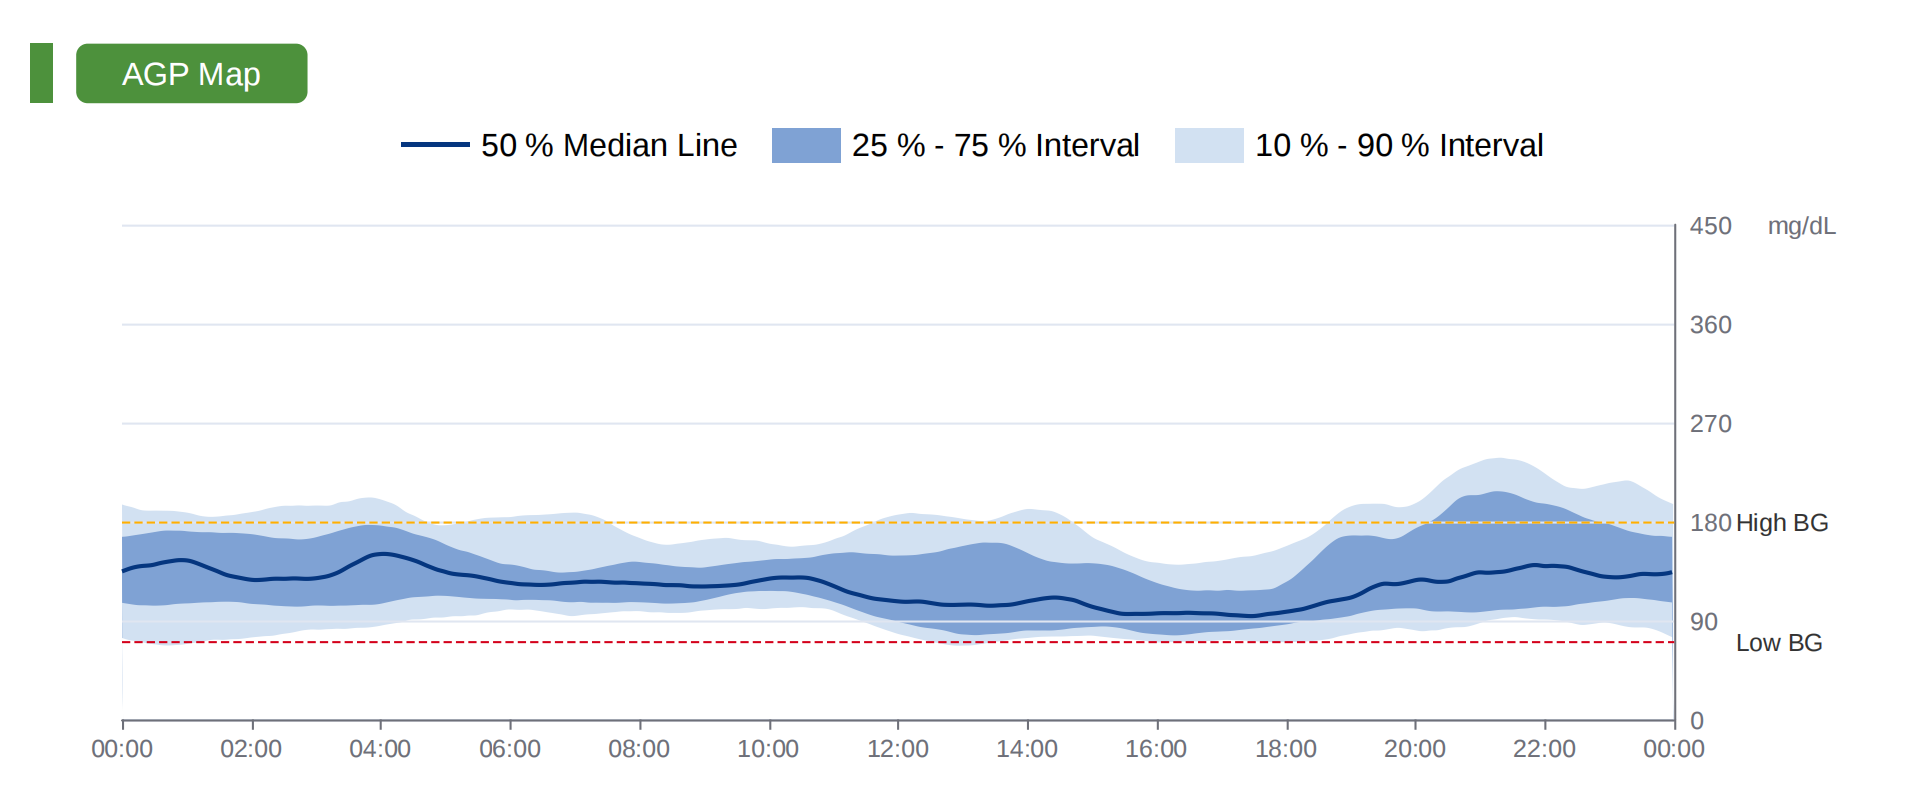

When continuous glucose monitoring reaches ≥5 days, an AGP MAP can be generated.
It overlays multiple days of glucose data to produce a “typical day” glucose map with a 24-hour x-axis.
The AGP MAP consists of three layers:
|
Layer |
Meaning |
Interpretation |
|
Median line (50%) |
Half of the readings are above, half below |
Represents the overall glucose trend |
|
25–75% range (dark band) |
Variability due to inherent factors (e.g., medication, diet pattern) |
Narrow and within target range = stable control |
|
5–95% range (light band) |
Variability due to sporadic factors (e.g., overeating, missed doses) |
Wide range = frequent sporadic fluctuations |
The median line displays the typical daily glucose pattern, while the shaded areas indicate variability across the map.
Hotspot identification:
If the band suddenly widens during a specific time on the MAP, it indicates significant glucose variability — a problem hotspot.
Recommended steps:
-
Identify hotspots first, then link them to possible causes:
○ Post-meal timing?
○ Exercise or medication adjustments?
○ Stress or sleep effects?
Additionally, the Daily Overlay MAP is a powerful tool to analyze recurring patterns of high or low glucose.
Repeated spikes or dips suggest opportunities for targeted interventions (e.g., meal splitting, pre-meal exercise, or medication timing adjustments).
Ideal AGP MAP characteristics:
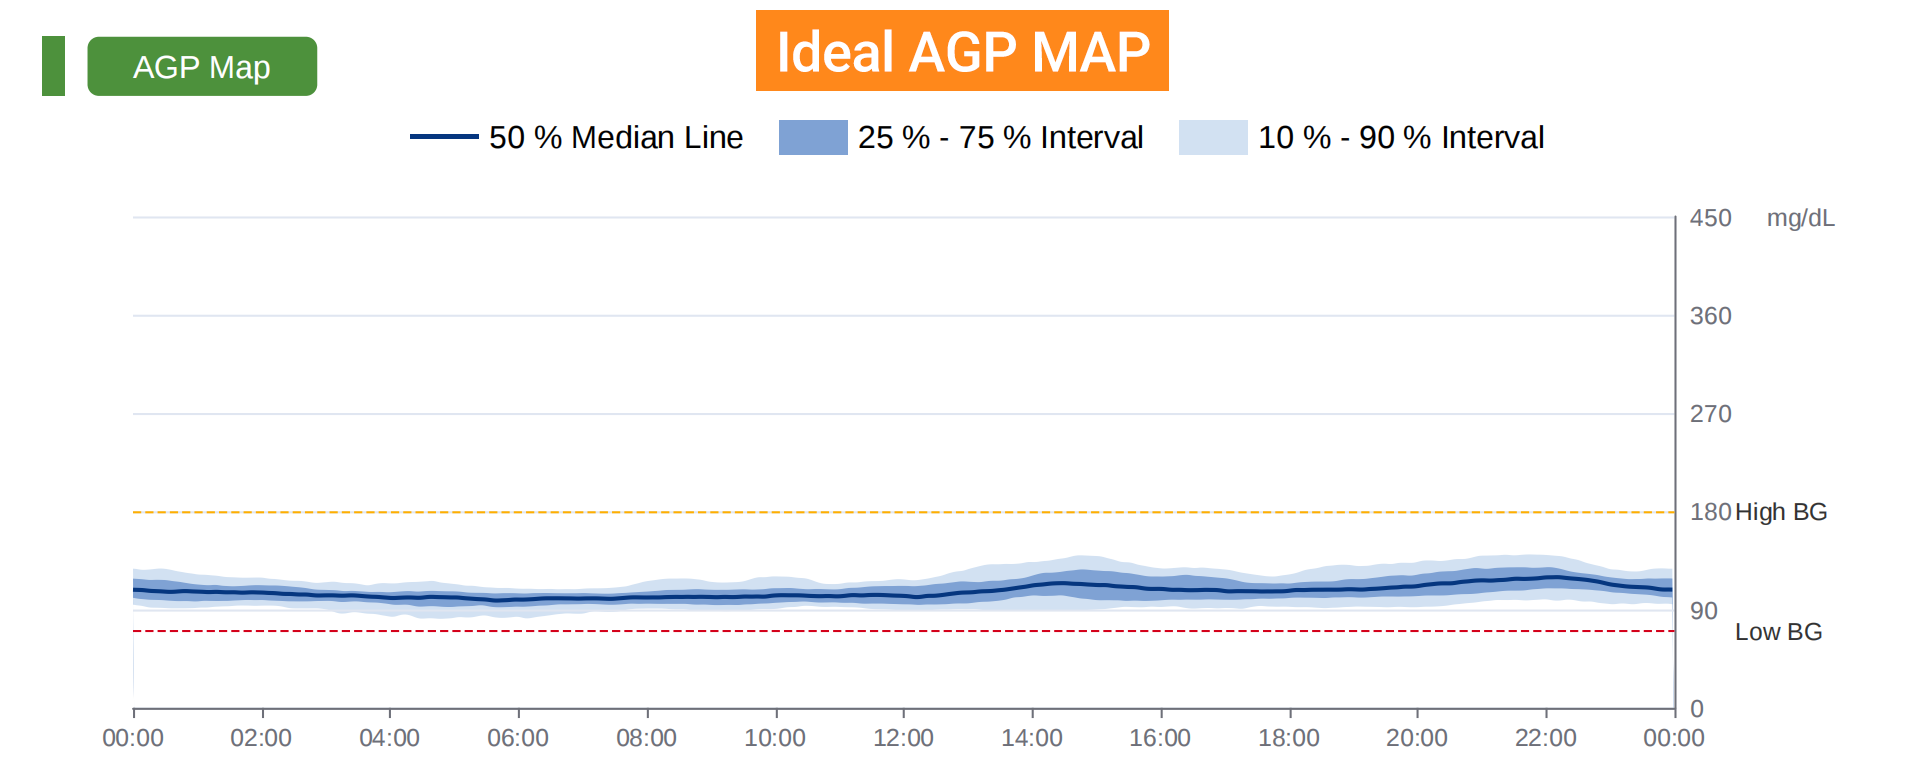

- Median line is smooth and stable
- Dark band is narrow and within target range
- Light band is close to the dark band, indicating small and stable variability
4. Module 3: Daily Glucose Curve
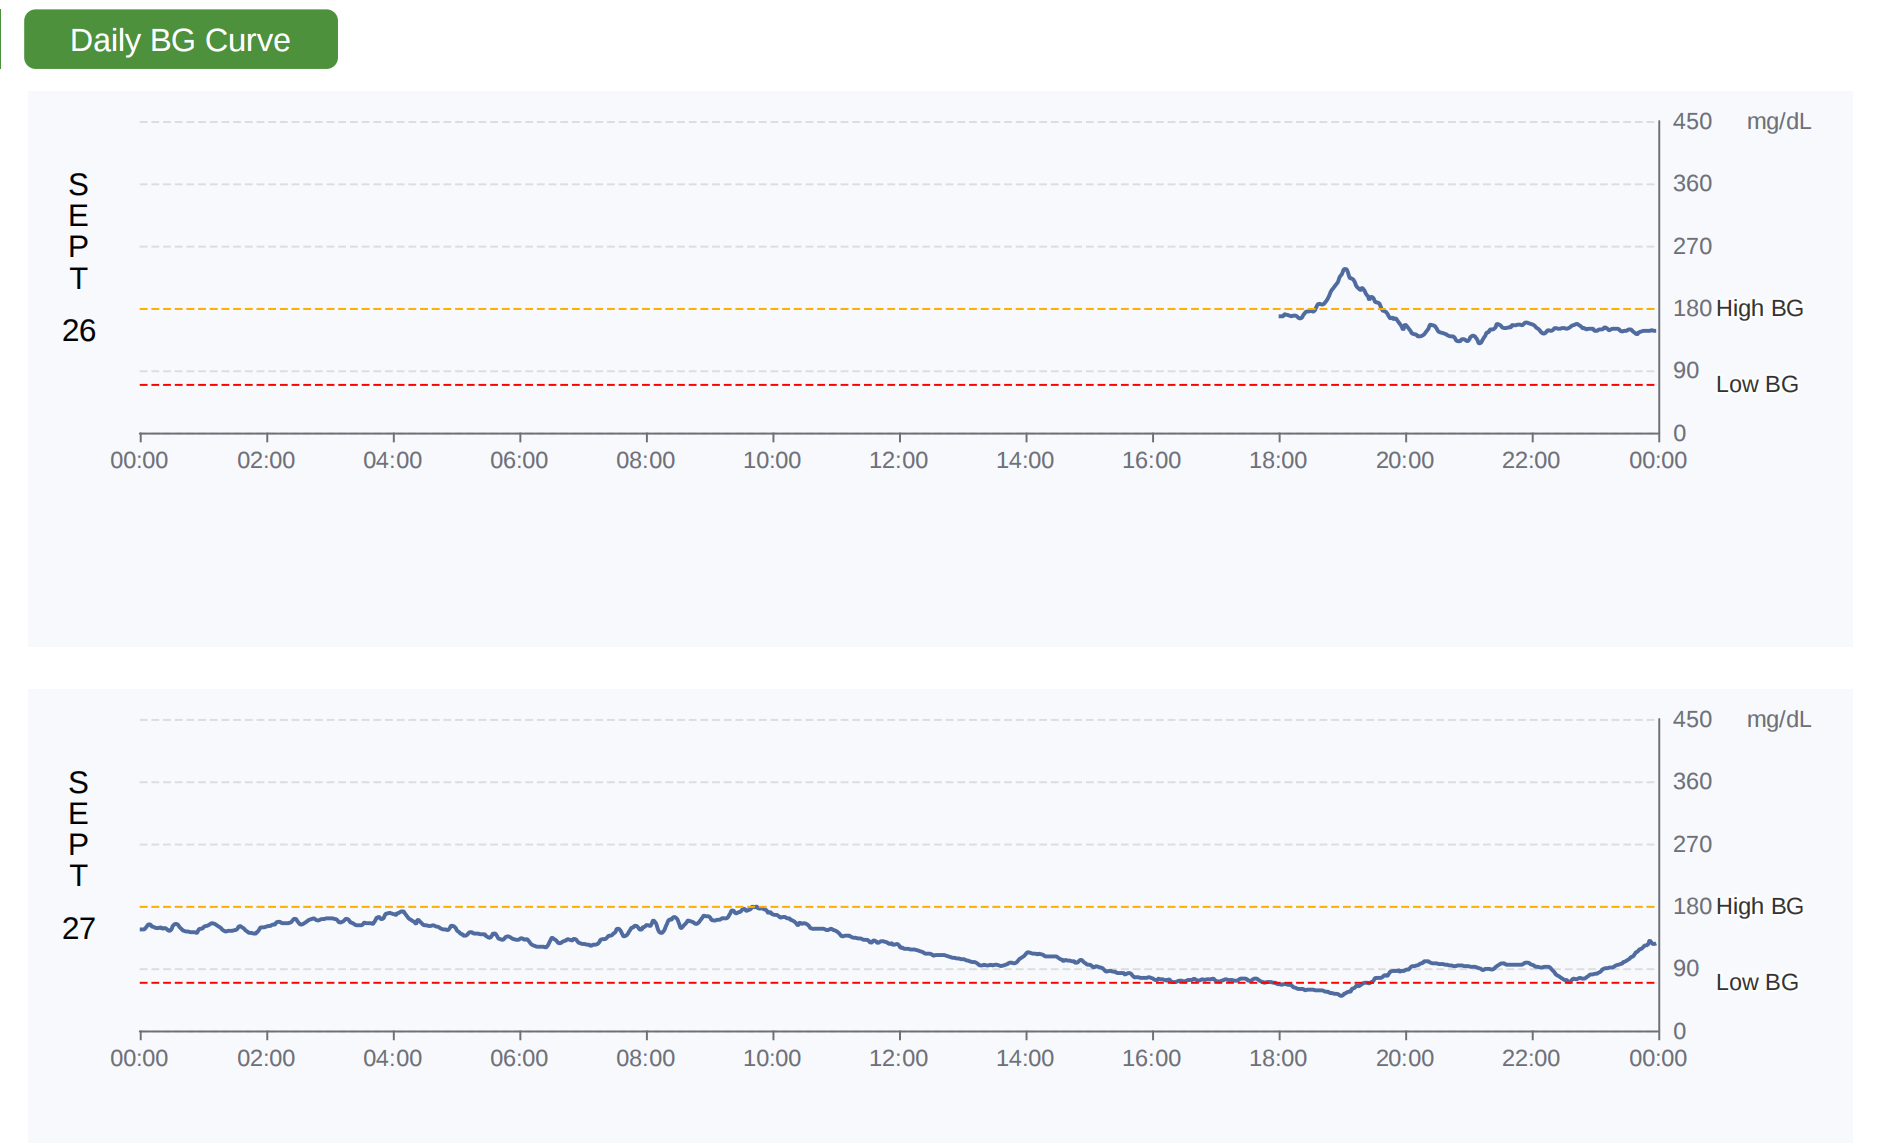


Daily curve allow detailed analysis of individual days’ glucose fluctuations. They help you:
- Observe pre-meal, post-meal, bedtime, and nighttime glucose patterns
- Compare with diet, exercise, medication, and emotional factors
- Identify triggers for high or low glucose
- Evaluate intervention effects (e.g., whether dietary or exercise changes improve stability)
By using daily profiles, you can transform data into an actionable plan, gradually achieving more stable and healthier glucose control.
Conclusion
The value of an AGP report lies not only in the numbers but in identifying patterns and improvement opportunities.
Master eHbA1c, TIR, and CV, and learn to interpret AGP profiles to turn glucose data into a powerful management tool.
Remember:
✅ Data must be reliable: “At least 14 days and ≥70% sensor usage.”
✅ Glucose control should be stable: eHbA1c < 7%, TIR > 70%, CV ≤ 36%
Let every glucose curve guide you toward a healthier life.


